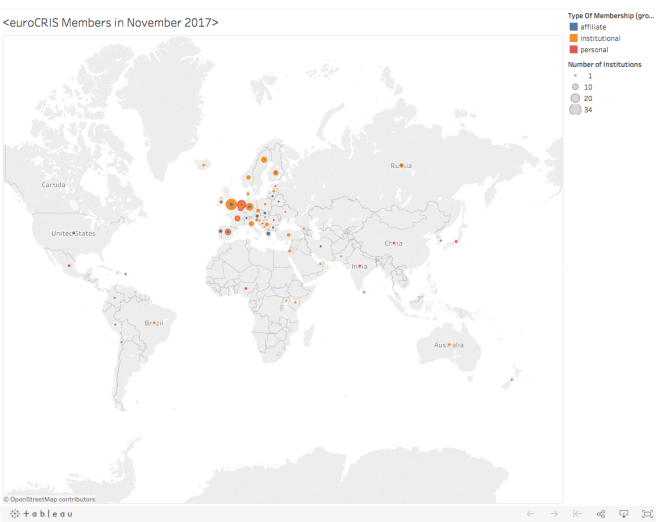
Recently, I attended a Tableau course on udemy and am now experimenting with what I learned. My first example is the visualisation of euroCRIS membership from data that I cleaned after extraction from the euroCRIS website in November 2017. It gives some insight into the structure of its global membership.